How to Create Report
Article pf0oTaR8 · sourceHow to Create Report
With the help of credentials, log in to the query builder. After logging in, you'll be taken to the Visualise section page. The visualisation section can be used to make reports. Take the steps below to get started.
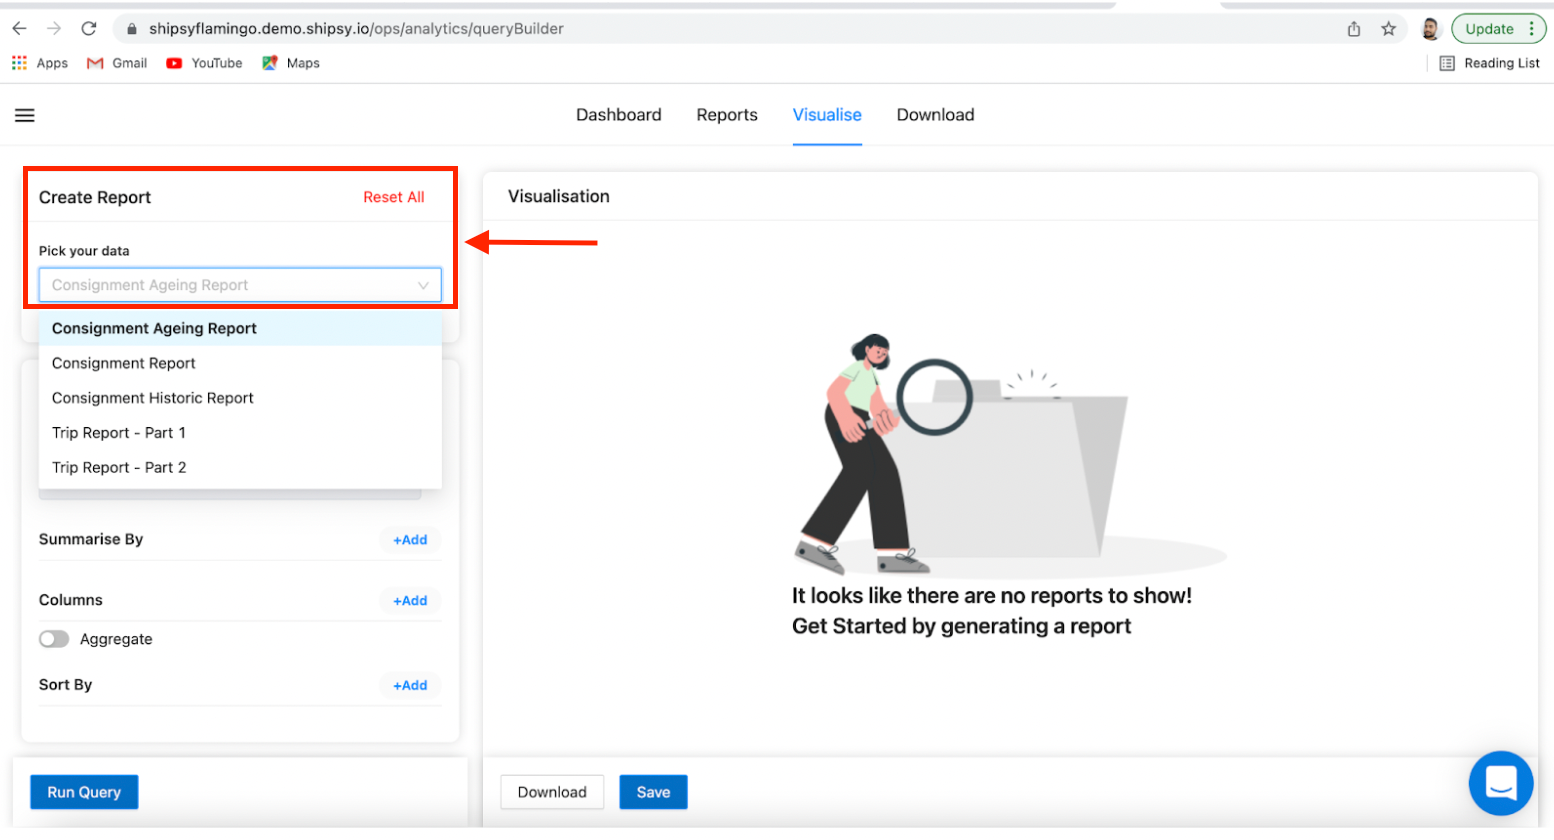
STEP 1: In the create report subsection, Choose your data type from ‘Pick your Data’.
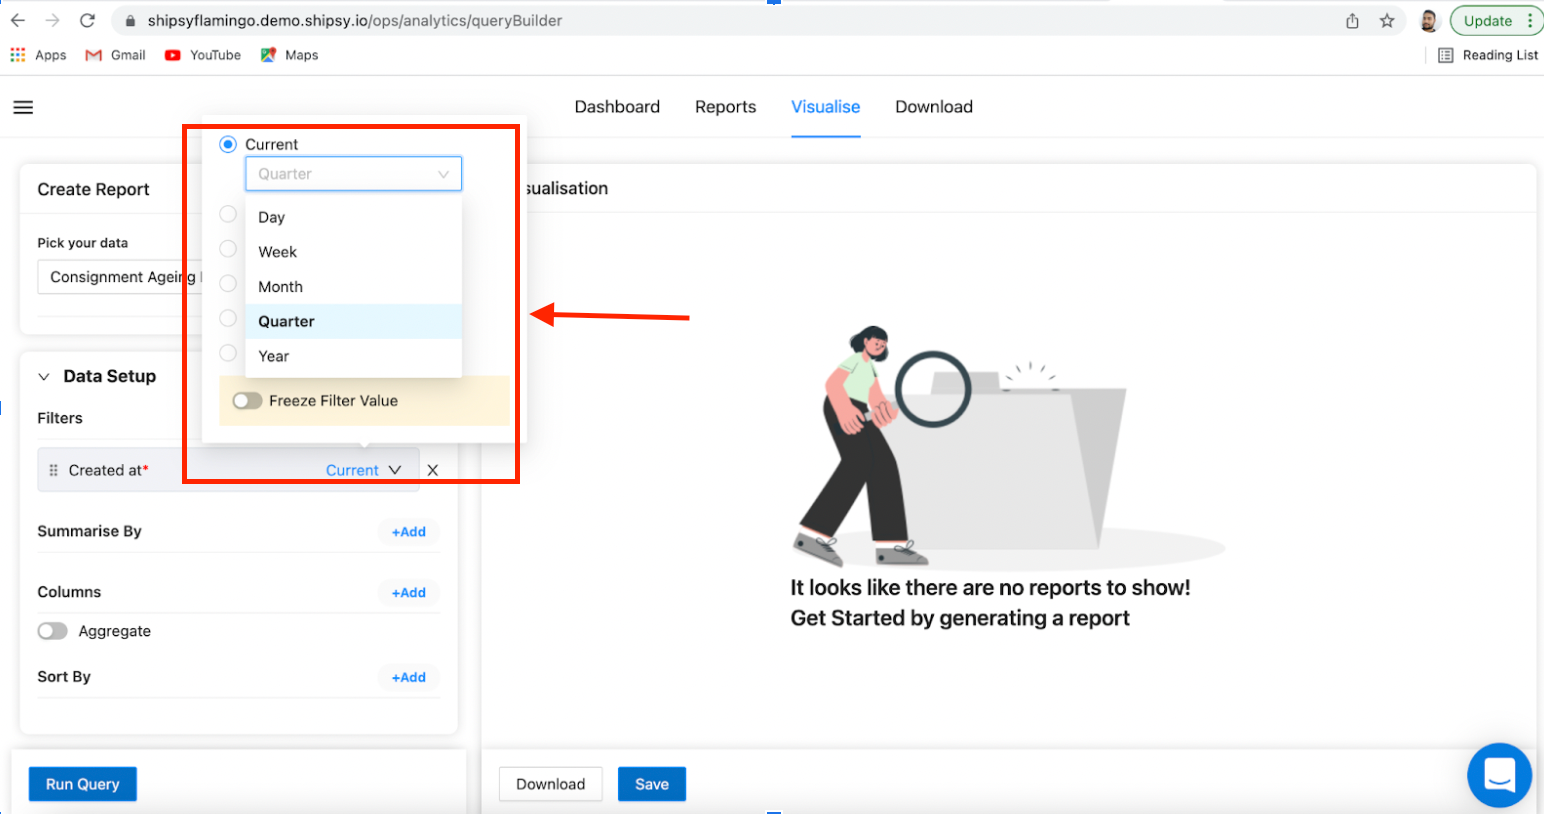
STEP 2: Select the timeline filter of which the report is to be generated. You can also filtering over selected column.
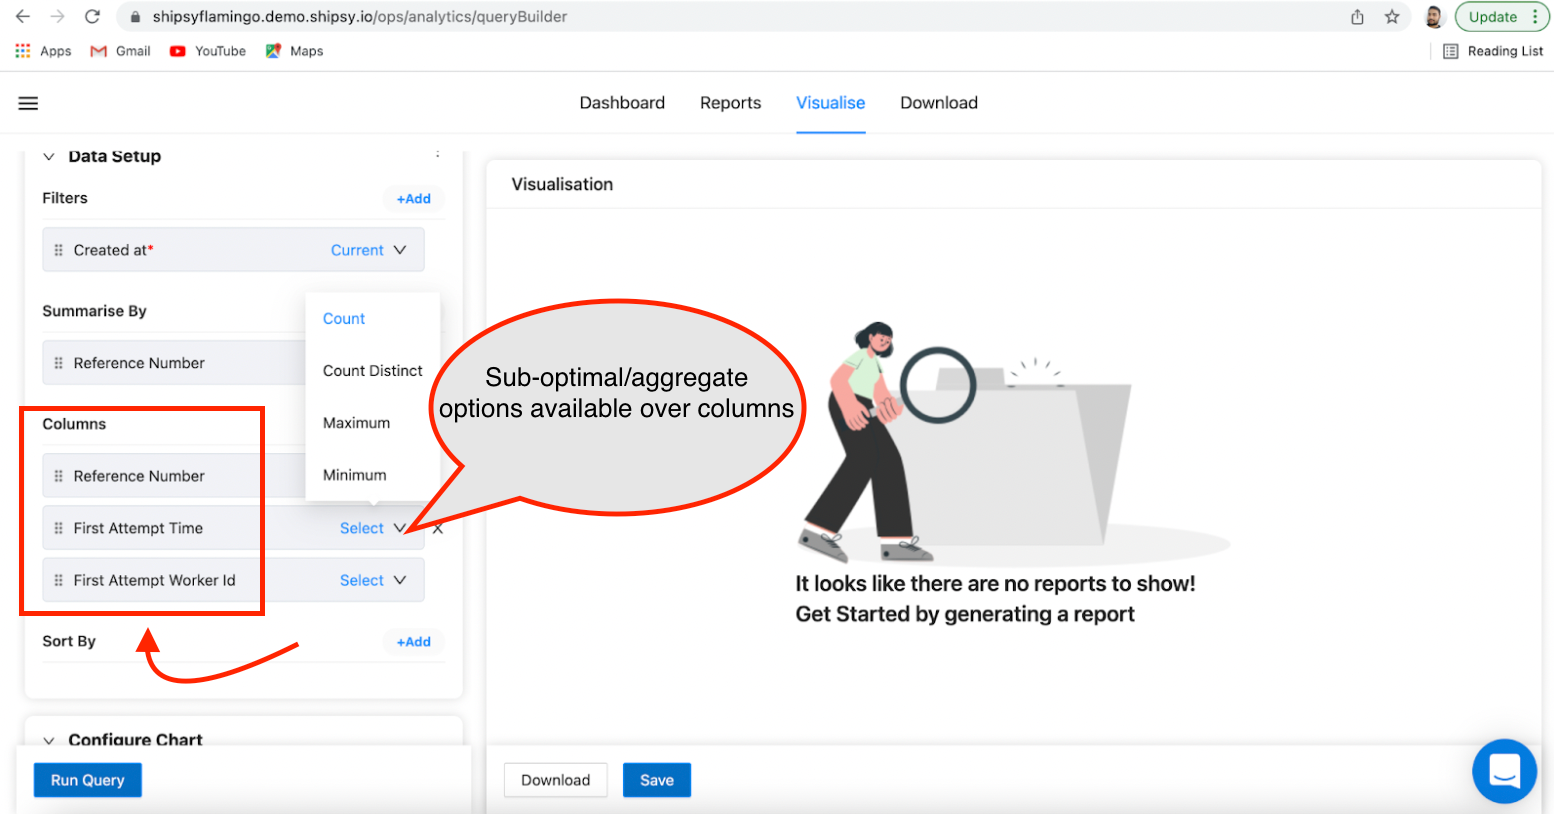
STEP 3: Choose the summarise by columns. In case the summary by option/s is Quantised, you may have to choose among other suboptimal options corresponding to the selected option.
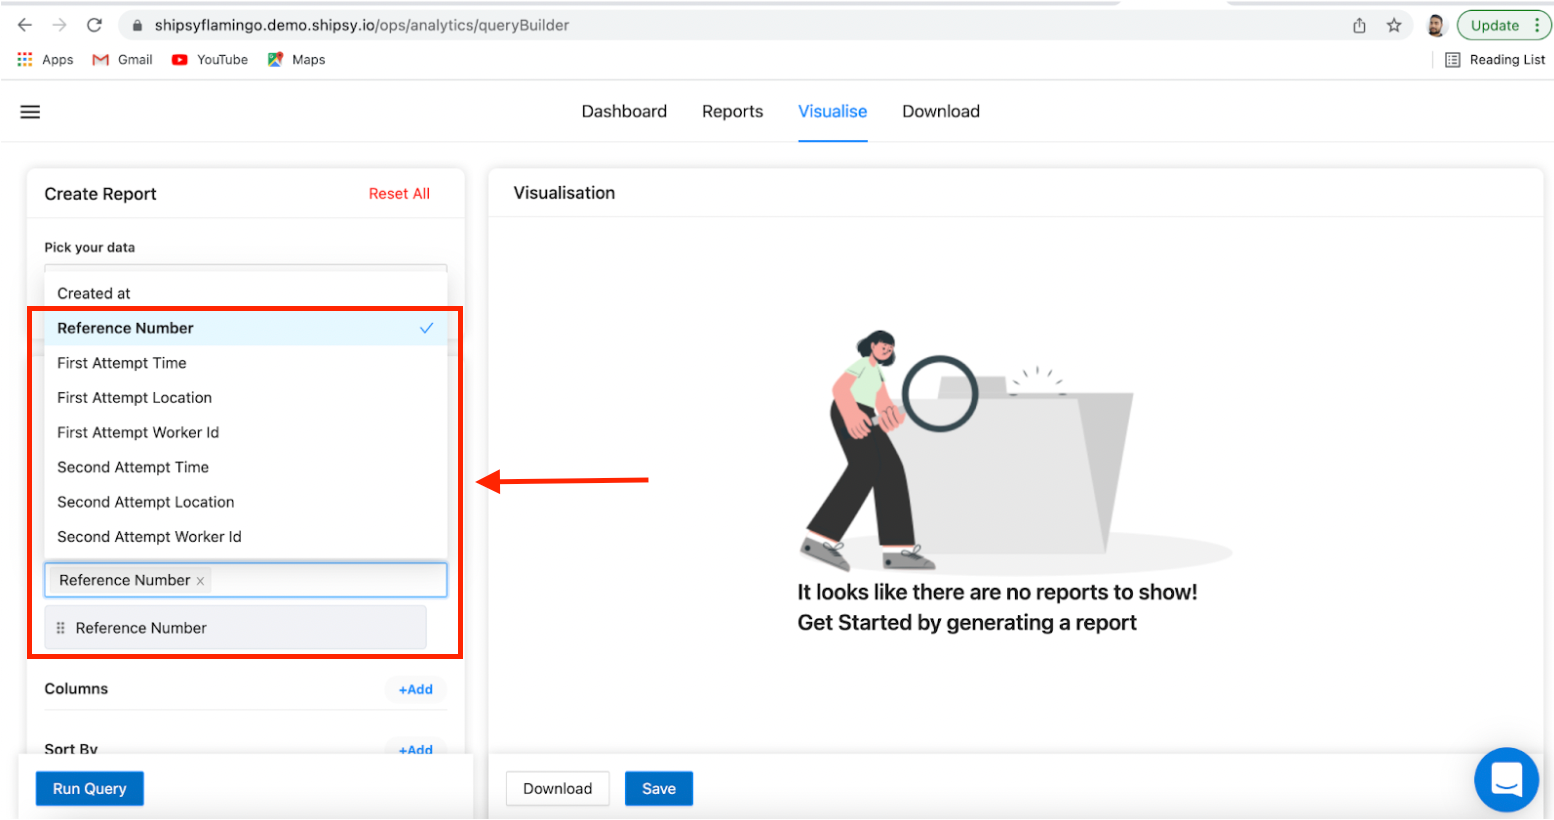
Note: Suboptimal options give an extra edge to better analyse the data. They are available with crucial metrics such as delivery time, cod amount, worker id identification and statistics around it.
STEP 4: Specify column names and add them to the report.
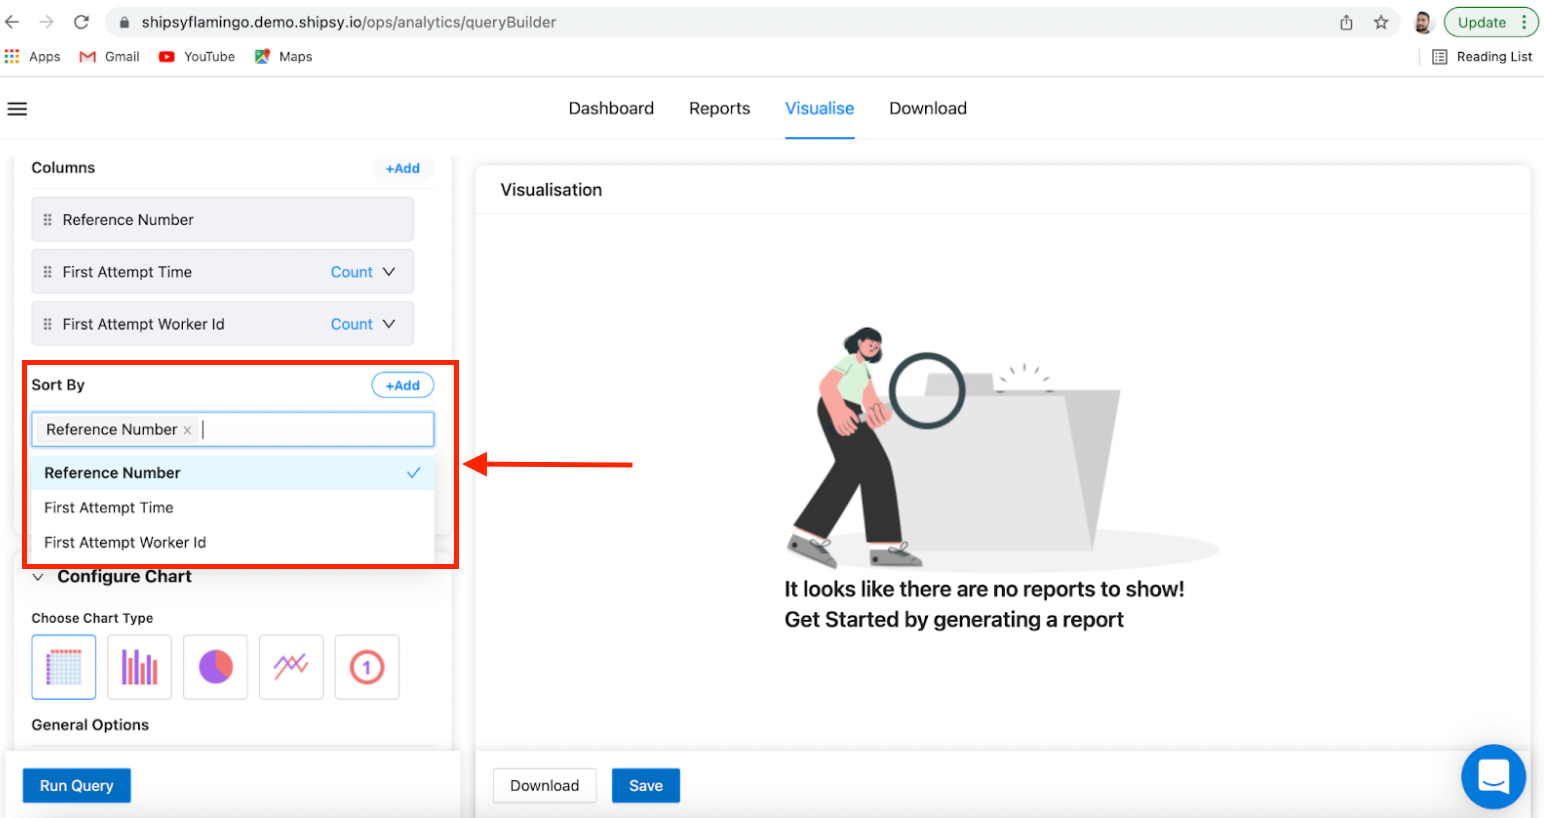
STEP 5: ADD sort by columns.
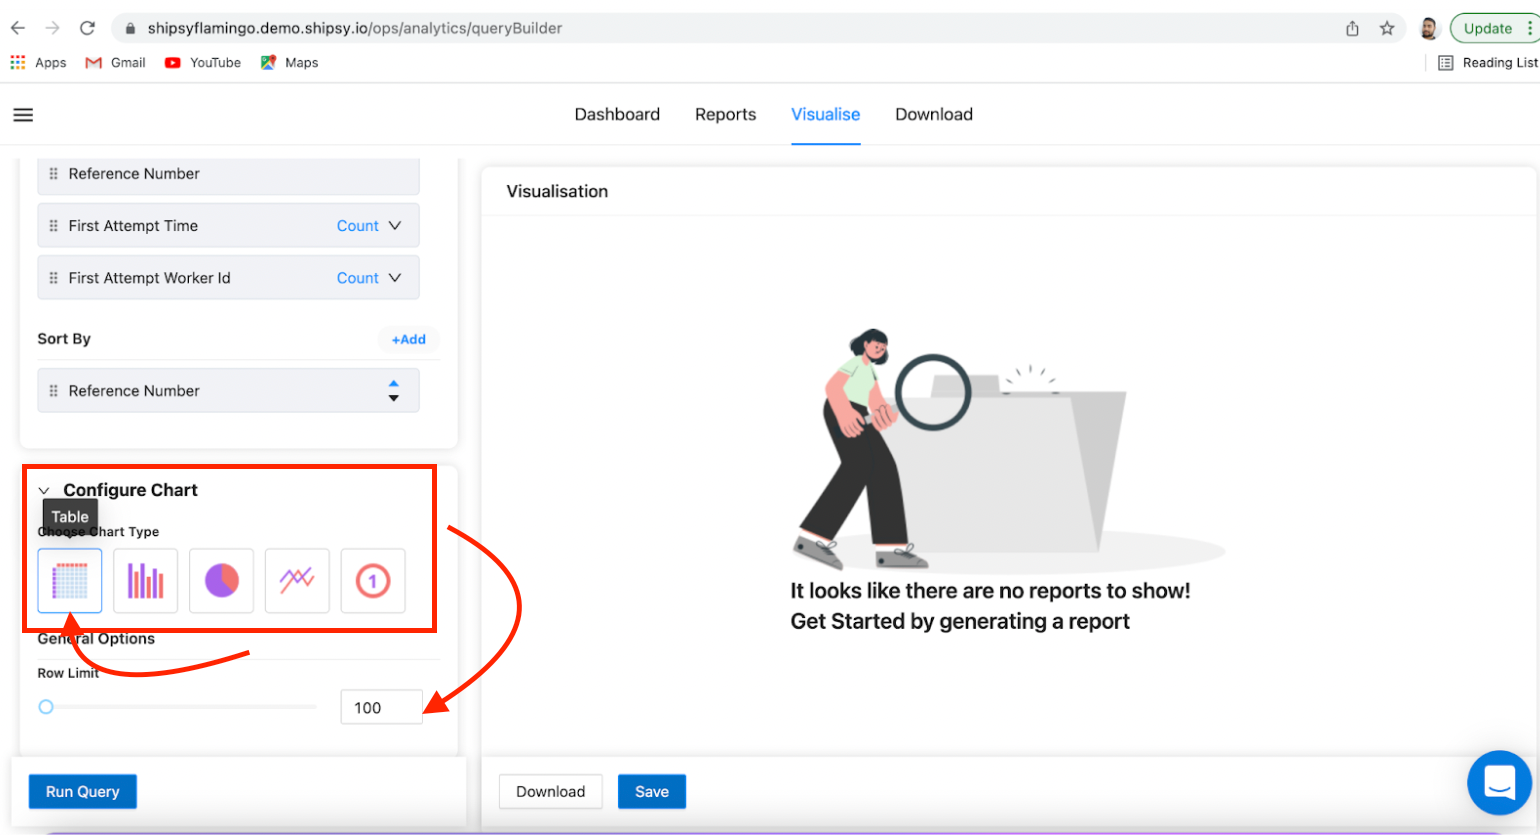
STEP 6: Choose the chart type from the configure chart menu. Meanwhile, also limit the rows.
Note:
In the configure chart menu, you may be asked to select other details such as axis info etc.. in case you want to generate graphs/ other visualisation.
STEP 7: Click on the 'Run Query’ button. Visualised data would appear on the page. (Illustration shown below)
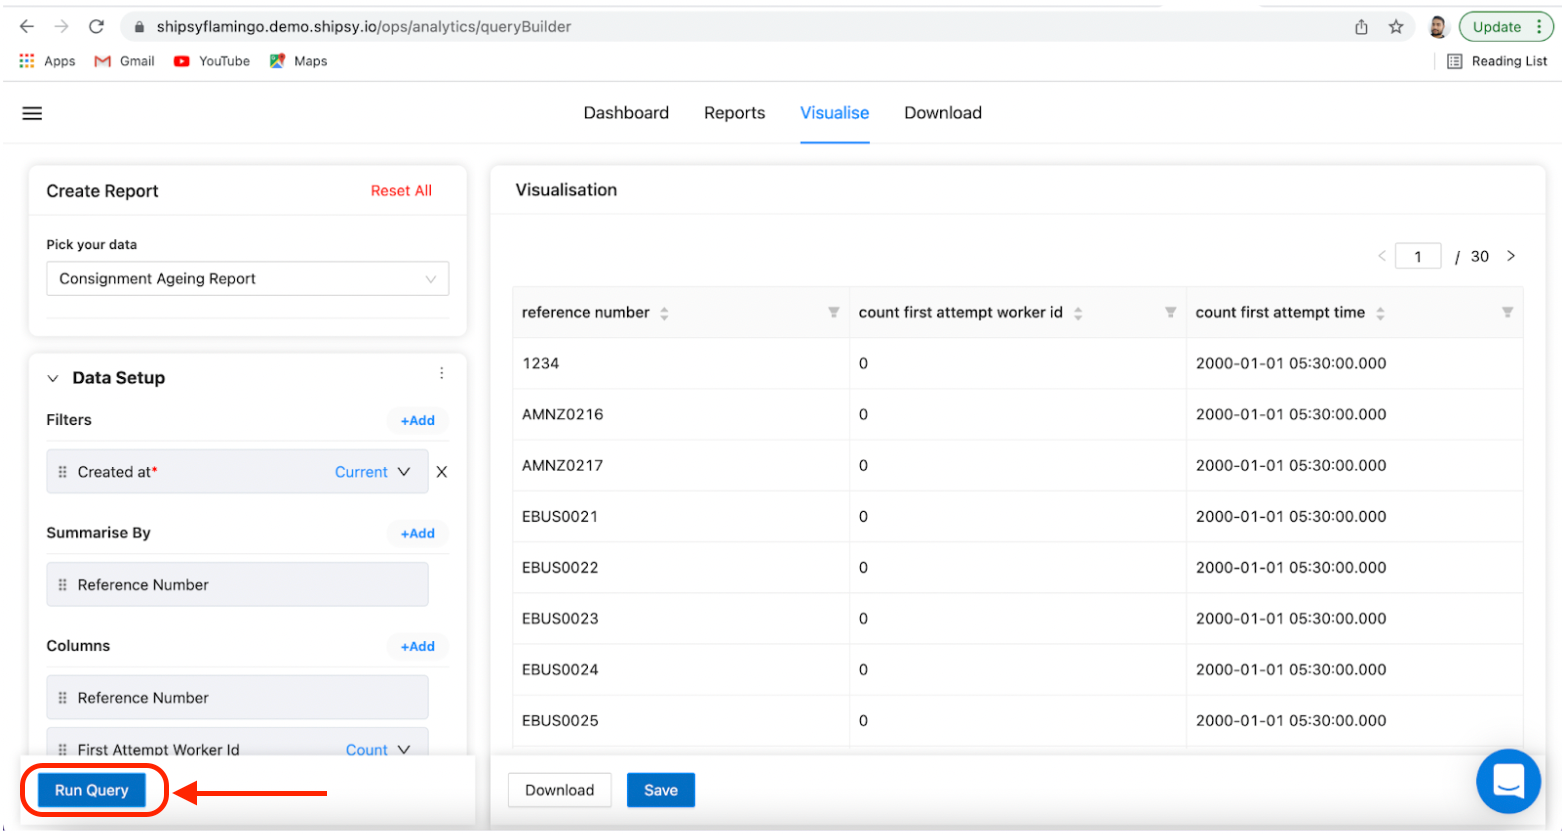
You can now see your created report in the visualise section. This report can be downloaded or saved as per requirements.